
Technical indicators are tools used to analyze market data and predict future price trends. They can be used by traders of all experience levels, from beginners to professionals.
Here are 6 important technical indicators that traders need to know when trading on Gate.io:
Relative Strength Index (RSI)
RSI is a momentum indicator that shows the strength or weakness of a trend. It is calculated by comparing the current closing price to the average closing price over a specified period of time.
RSI ranges from 0 to 100. An RSI value below 30 indicates a downtrend, an RSI value from 30 to 70 indicates a sideways trend, and an RSI value above 70 indicates an uptrend.
Momentum
Momentum is an indicator that shows the rate of change of price. It is calculated by comparing the current closing price to the closing price of a specified number of periods before.
Momentum can be used to identify emerging trends and identify reversal points.
Moving Average (MA)
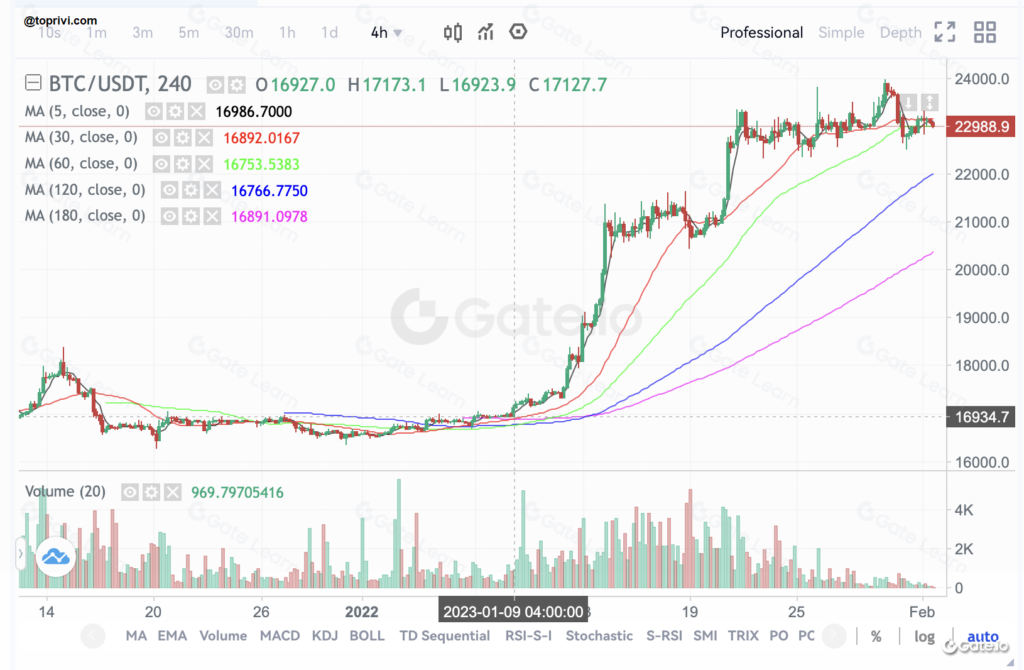
MA is a trend indicator that shows the average price trend over a specified period of time.
MA can be used to identify the overall trend of the market and identify support and resistance levels.
Moving Average Convergence Divergence (MACD)
MACD is a trend indicator that shows the change in the price trend. It is made up of two MAs, the MACD line and the signal line.
MACD can be used to identify emerging trends, identify reversal points, and identify entry and exit points.
Bollinger Bands
Bollinger Bands is a momentum indicator that shows the volatility of price. It is made up of three lines, the moving average, the upper band, and the lower band.
Bollinger Bands can be used to identify entry and exit points, identify emerging trends, and identify reversal points.
Fibonacci
Fibonacci is a technical indicator based on the Fibonacci sequence, a series of natural numbers with a close relationship to each other.
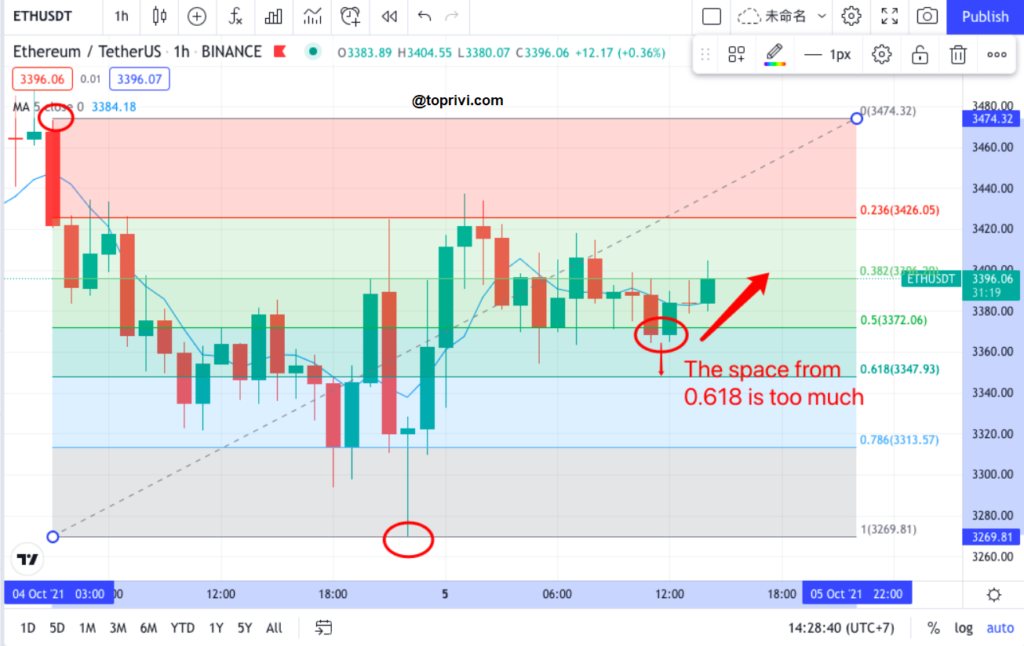
Fibonacci can be used to identify support and resistance levels, identify emerging trends, and identify reversal points.
To use technical indicators effectively, traders need to understand how to calculate them and how to interpret the signals they generate. Traders also need to combine different technical indicators to get a more complete picture of the market.
Here are some tips for using technical indicators effectively:
- Start with a few technical indicators and learn how to use them effectively before adding more indicators.
- Use different technical indicators to confirm each other’s signals.
- Don’t rely solely on technical indicators. Always use your own judgment and consider the fundamental factors of the market.

Technical indicators are a valuable tool that can help traders trade more effectively. However, they are not a guarantee of profits. Traders need to use technical indicators carefully and combine them with other factors to make sound trading decisions.
Source: Team Toprivi compiled, analyzed and wrote.