OKX offers a variety of important indicators that traders can use to track the cryptocurrency market and make informed trading decisions.
Here are eight key indicators that traders should keep an eye on:
1. Price
Price is the most important indicator in the cryptocurrency market. It tells you the value of a cryptocurrency at a specific point in time. Traders can use price to identify market trends, identify potential entry and exit points, and calculate profits or losses.
2. Trading Volume
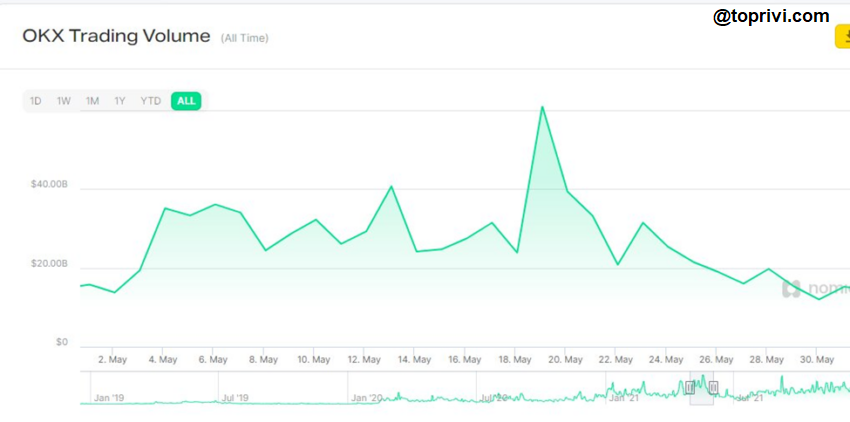
Trading volume tells you the number of assets that have been traded in a given period of time. It is an important indicator for gauging the level of market interest in a cryptocurrency. High trading volume often indicates that demand for a cryptocurrency is increasing, which could lead to price increases. Conversely, low trading volume often indicates that demand for a cryptocurrency is decreasing, which could lead to price decreases.
3. Liquidity
Liquidity is the ability to buy or sell an asset easily and quickly at a fair price. High liquidity is ideal for traders, as they can execute trades without having to pay high fees or large spreads.
4. Volatility
Volatility tells you the degree of price change for an asset in a given period of time. High volatility often indicates an unstable market that is prone to price swings. Conversely, low volatility often indicates a stable market with little price fluctuation.
5. Moving Averages
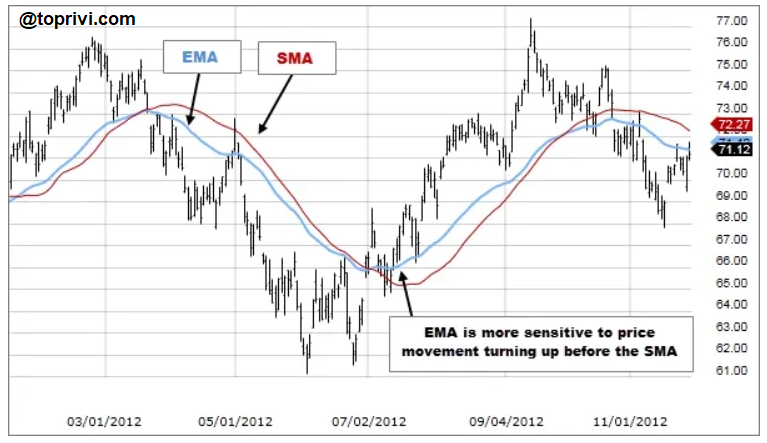
Moving averages are a technical indicator that can help identify market trends. A simple moving average (SMA) is calculated by taking the average price of an asset over a specified period of time.
6. Stochastic Oscillator
The stochastic oscillator is a technical indicator that can help identify potential entry and exit points. The stochastic oscillator is calculated by comparing the current price of an asset to its highest and lowest values over a specified period of time.
7. Relative Strength Index (RSI)
The relative strength index (RSI) is a technical indicator that can help identify overbought or oversold conditions for an asset. RSI is calculated by comparing the change in price for an asset to its average value over a specified period of time.
8. Moving Average Convergence Divergence (MACD)
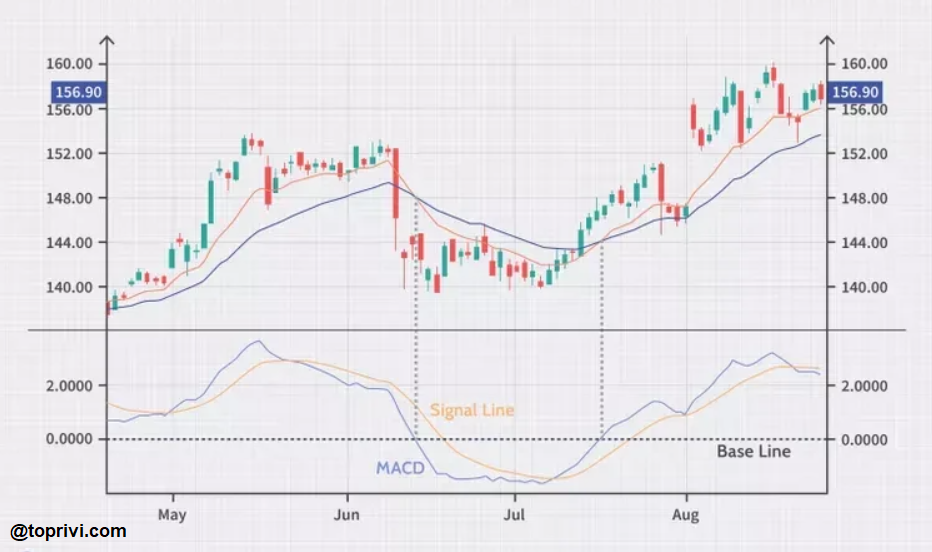
The moving average convergence divergence (MACD) is a technical indicator that can help identify market trends and potential entry and exit points. MACD is calculated by comparing two moving averages.
How to Use Indicators on OKX
Traders can use the indicators on OKX in a variety of ways. Here are a few examples:
- Use price and trading volume to identify market trends: If price and trading volume are both increasing, then the market is in an uptrend. Conversely, if price and trading volume are both decreasing, then the market is in a downtrend.
- Use volatility to identify when to trade: High volatility is often a sign of trading opportunities, as prices can move sharply. Conversely, low volatility is often a sign of a time to trade cautiously, as prices may be less volatile.
- Use technical indicators to identify potential entry and exit points: Technical indicators can help traders identify potential entry and exit points based on historical price data.
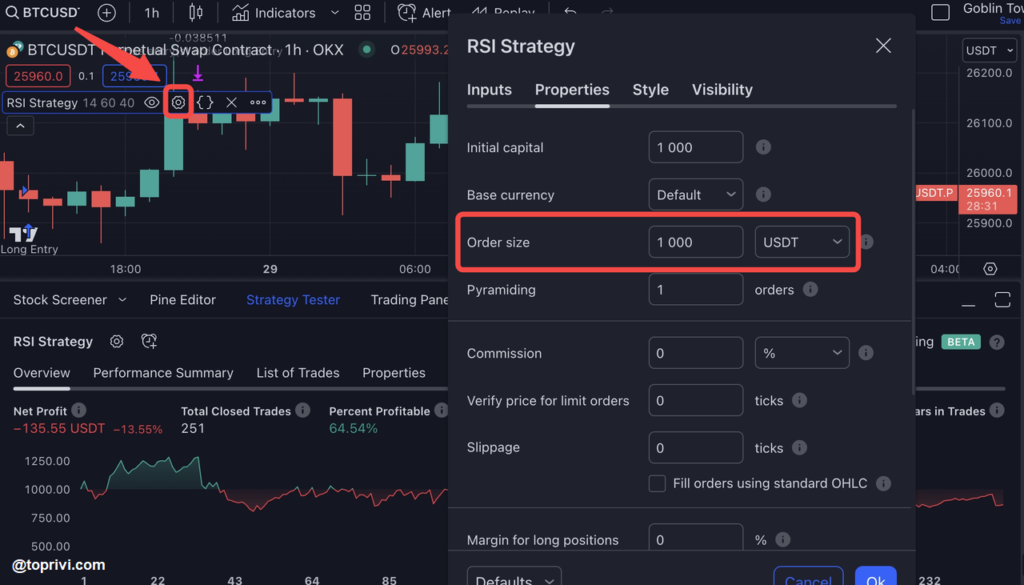
Things to Keep in Mind When Using Indicators on OKX
The indicators on OKX can be a valuable tool to help traders make informed trading decisions. However, traders should keep in mind a few things when using these indicators:
- Indicators are not a crystal ball: Indicators only provide information and do not guarantee that their predictions will be accurate.
- Indicators should be used in combination: It is not advisable to rely on a single indicator to make a trading decision.
- Indicators should be adjusted to fit your trading style: The best way to use indicators will vary depending on your individual trading style and risk tolerance.
Source: Team Toprivi compiled, analyzed and wrote.